
Quite a large number of things in our world occur in several cycles, from fashion trends to the movement of planets. Pricing in markets occurs in a similar way. The value of a certain asset is formed as a result of the influence of people, or rather their behavior, which is provoked by the development cycles of society.
In the first half of the last century, a theory was developed that stated that the price of an asset moves in waves and has a clear structure. The author of this work was the American Ralph Nelson Elliott, who works as a financier. This theory is called the Elliott wave theory.
It is quite voluminous, but is of great interest to traders around the world. In this article we will try to understand the main ideas of the teachings of the American financier. For those who wish to understand the wave theory more deeply, there is special literature.
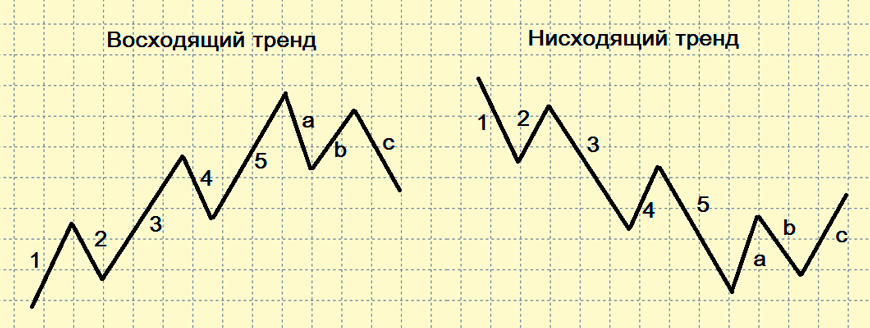
Elliott Wave Theory: Structure 5-3
Elliott's theory states that the structure of any trend has 5 waves, followed by a correction of three waves.
At first glance it may seem that there is nothing complicated about this, but in practice things are completely different. Most traders face the same problem - correctly identifying the beginning of a wave and its end. Simply put, it is difficult to find points to enter and exit the market.
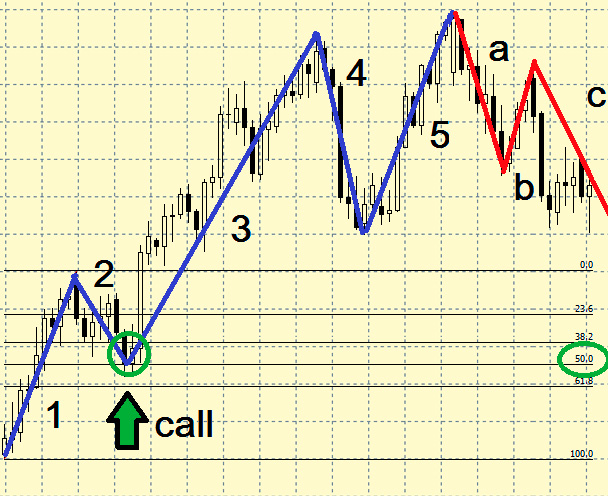
One of the tools that allows you to use wave theory more efficiently is Fibonacci numbers. It was these that Elliott used to create his theory. Fibonacci levels , provided they are constructed correctly (along impulse waves), make it possible to calculate the length of correctional ones.
Application of Elliott wave theory in practice
Below are a few tips to help you identify waves.
- Wave No. 1. Characterizes the emergence of a trend. In most cases, it begins to form after the price breaks through an important support/resistance level.
- Wave No. 2. Characterizes a rollback, the magnitude of which is part of wave No. 1. The second wave can never be greater than the first.
- Wave No. 3. Of greatest interest to traders. This is often the longest wave of the cycle. This is where the maximum profit is made.
- Wave No. 4. Characterizes a small rollback. The price should not cross the line of the top of the first wave.
- Wave No. 5. The final impulse. Characterizes a weakening trend. Most often accompanied by divergence of indicators and a decrease in volumes.
- Wave A. Trend change. The wavelength is insignificant due to the fact that there are still players on the market waiting for the trend to continue.
- Wave B. Less than waves A and C.
- Wave C. The strength and length of this wave is the highest. You can now forget about the previous trend.
Wave theory is relevant for any time frame. On a higher timeframe, one wave is a complete cycle of 8 waves on a lower one.
It is not always possible to accurately calculate each wave. Only experienced traders can cope with this. For this reason, people who trade using Elliott theory try to open their positions at the very beginning of the third wave, since it is the longest and promises the greatest profit. All searches boil down to finding her. To locate waves on the chart, you can additionally use indicators such as fractals or ZigZag.
We recommend testing all new strategies and indicators for binary options without the risk of losing your main deposit. A good option would be to try them out using risk-free day trading on the financial market from Grand Capital .
Can't figure out how this strategy or indicator works? Write about it in the comments to this article, and also subscribe to our YouTube channel WinOptionCrypto , where we will definitely answer all your questions in the video.

To leave a comment, you must register or log in to your account.