
Binary options double and triple top and bottom indicators are technical in the literal sense. They mark on the chart where such patterns form and provide signals that indicate when to enter a trade. Working with such indicators makes it very convenient to trade patterns in binary options.
Characteristics of indicators for binary options Price Patterns
- Terminal: MetaTrader 4 .
- Time frame: H1.
- Expiration: 1 hour.
- Types of options: Call/Put.
- Indicators: PA PZ DoubleTopBottom, PA PZ TripleTopBottom.
- Trading instruments: Any.
- Trading time: Any.
- Recommended brokers: Quotex , PocketOption , Alpari, Binarium .
Installing Price Patterns Indicators in MT4
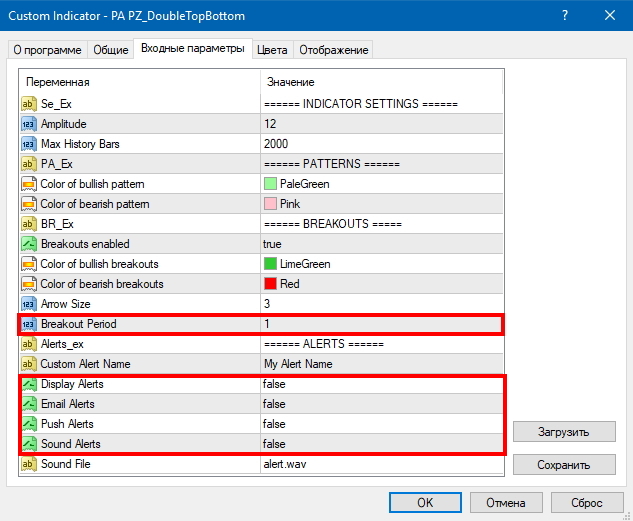
When adding indicators to the chart, you need to change the “Breakout Period” parameter in the settings from the value “2” to the value “1” so that the signals do not lag. Also, if you want to receive sound signals when forming figures, then change the “Display Alerts” and “Sound Alerts” parameters to “true” in both indicators:
To avoid setting up the schedule yourself, you can download a template at the end of the article.
Instructions for installing indicators in MetaTrader 4:
Rules for trading using Price Patterns indicators
If you know what a trend is and why it is so important to be able to determine it in financial markets , then it will be much easier for you to use any indicators, since you will understand when to enter a trade and when not, even if all binary options indicators give a signal. In the case of these two indicators, understanding the trend will also not be superfluous, but you can work with double and triple tops and bottoms against the main trend.
Before describing the rules for entering trades, let's look at how double and triple tops and bottoms visually look.
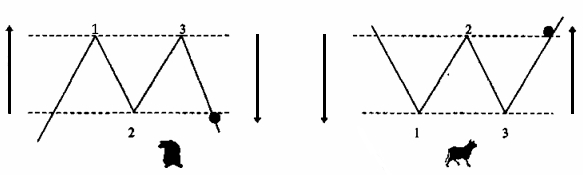
The picture on the left shows a version of the bearish scenario when a double top is formed. The figure on the right shows a “bullish” scenario when a double bottom is formed:
This is what triple tops and bottoms look like:
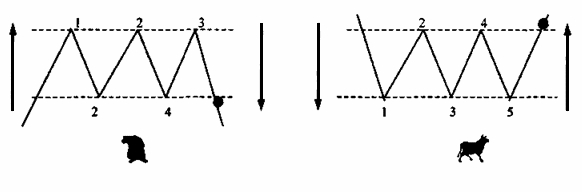
The only difference between them is the number of extremes.
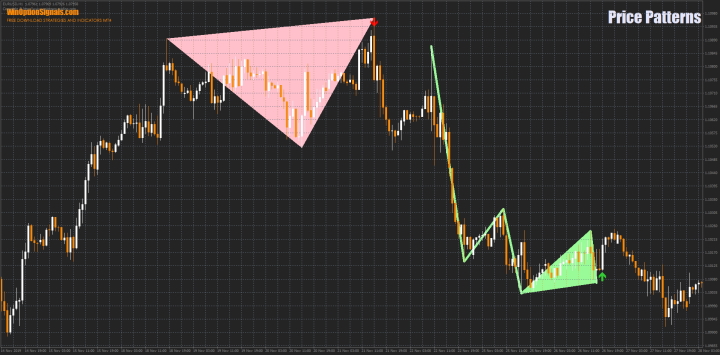
And this is how these figures look on the chart:
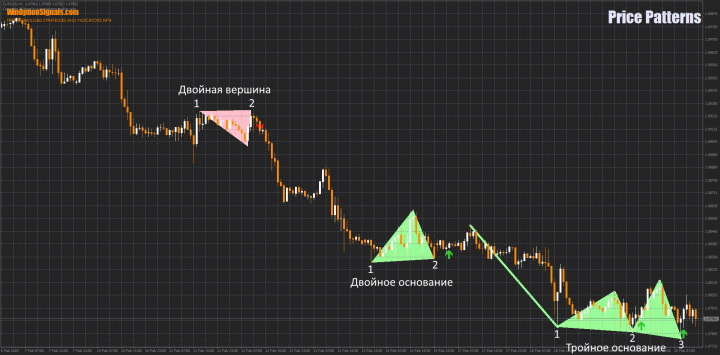
Most often, these patterns are formed during a reversal of the main trend. But they can also appear in corrective movements along the trend and against the trend.
Having understood what these patterns look like, you can go directly to the rules for opening options. Standard signals for entering a position are considered to be breakouts of the levels at which patterns have formed (marked with black circles in the figures above), but since we have an indicator that produces signals, we will act much earlier. So, to open a Call option we need to:
- A double or triple bottom pattern has formed and a buy signal has appeared (green arrow).
- Wait for the signal candle to close.
To open a Put option we need to:
- A double or triple top pattern has formed and a sell signal has appeared (red arrow).
- Wait for the signal candle to close.
Examples of trading using Price Patterns indicators
We will analyze examples on the EUR/USD currency pair and the H1 time frame, since technical analysis figures show the best results on large time frames. Expiration length for options is 1 hour.
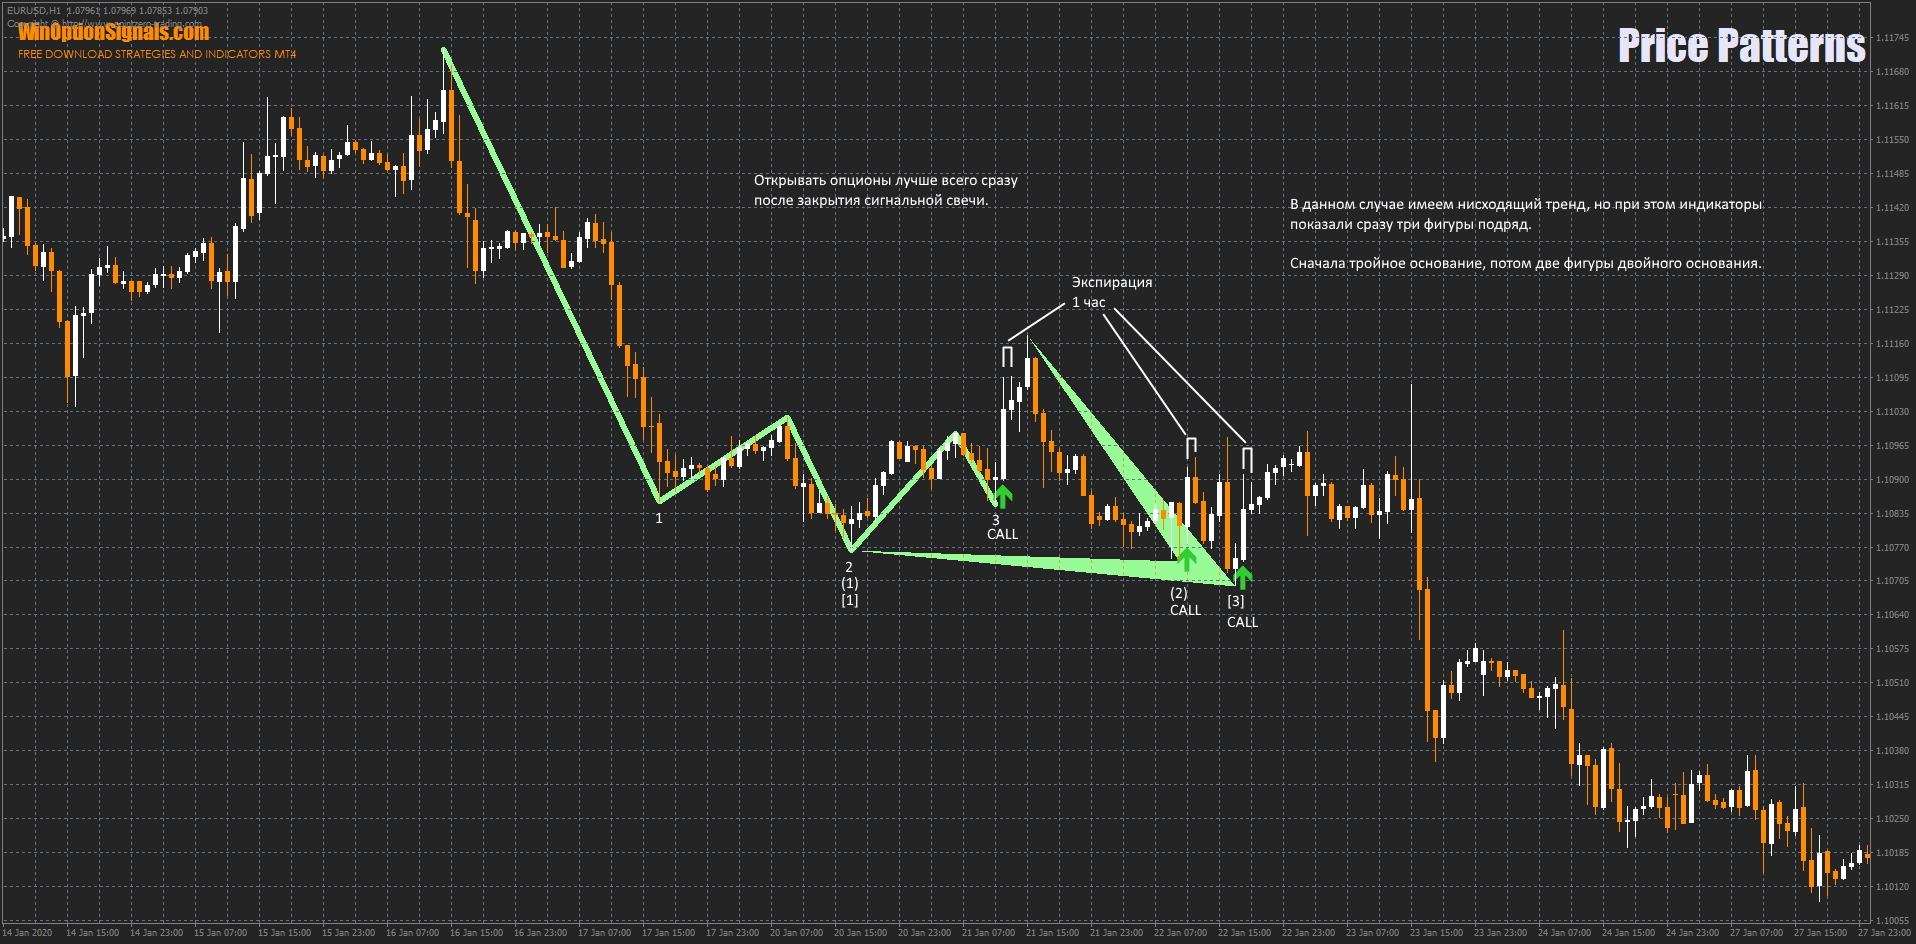
Opening Call Options
The examples of call options trades in this example can be considered complex, and beginners may not immediately understand what is what, but they are worth considering, since such situations do not occur rarely.
As you can see, the indicator can form three figures in a row, mixing them. But even if you decided to open trades based on all three signals, you would get a profit in two out of three trades.
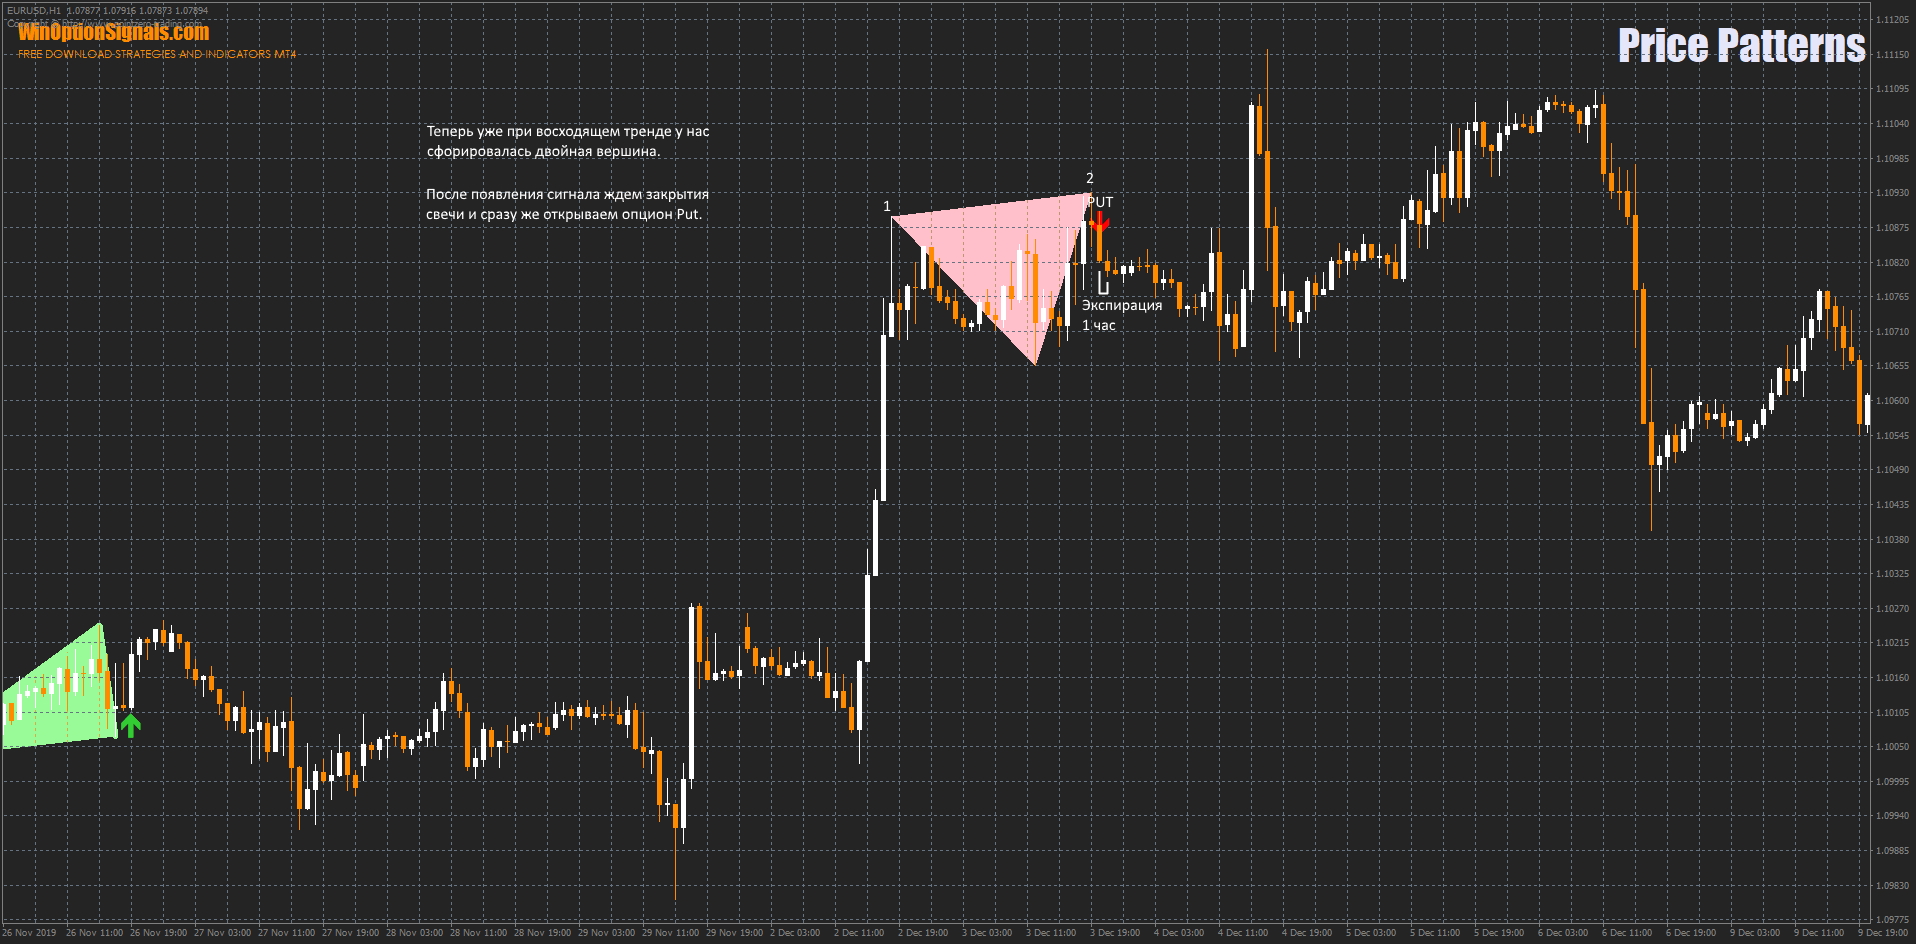
Opening a Put option
Here the situation is much simpler and clearer. A standard double top has formed, after which, after waiting for a signal from the indicator and the closing of the signal candle, you can immediately open a Put option with an expiration of 1 hour.
Other technical analysis pattern indicators for binary options
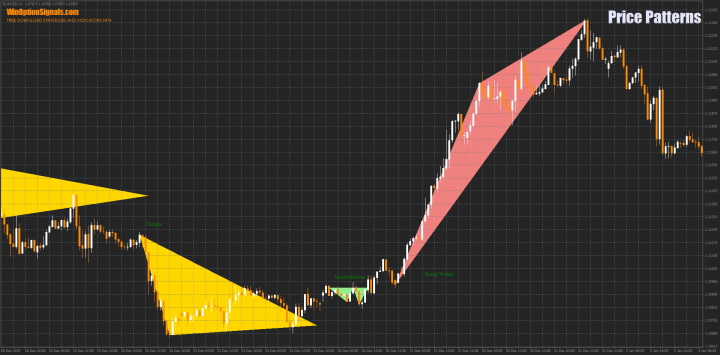
There is another indicator for binary options called Triangles and Flags, which marks not only double and triple tops and bottoms on the chart, but also ascending triangles, descending triangles, flags and some other figures. But, unfortunately, it has a drawback that prevents you from entering a trade on time - figures can sometimes be drawn late. But you can still get acquainted with it, and perhaps find a worthy use for it.
Conclusion
Now we can say with confidence that technical analysis figures are valuable for any trader, since no one limits their use on large time frames. The same patterns are formed on M1 charts. But due to the fact that there is more price noise on small time frames, it is best to use them on H1 and above.
The main thing is not to forget to test all indicators and strategies on demo accounts, and if you don’t know which broker to choose for this, you can check out the ratings of binary options brokers on our website. We wish you successful trading!
Download the Price Patterns template and indicators
Download the Triangles and Flags template and indicator
Can't figure out how this strategy or indicator works? Write about it in the comments to this article, and also subscribe to our YouTube channel WinOptionCrypto , where we will definitely answer all your questions in the video.

See also:
Best reversal indicators for binary options
To leave a comment, you must register or log in to your account.