
The Volume Delta binary options indicator analyzes the balance of power between sellers and buyers at a certain price level. Its operation is based on a simple but effective principle: the dominance of buyers, as a rule, leads to an increase in prices, while the predominance of sellers leads to a decrease in prices.
In this review, we will look at the features of the Volume Delta indicator, teach you how to interpret its trading signals , and show you how to use them to successfully assess the potential of each trade.
Content:
- Characteristics
- Installation
- Overview and settings
- Volume Delta Trading Rules
- Specifics of application
- Conclusion

Characteristics of the Indicator for Binary Options Volume Delta
- Terminal: TradingView
- Timeframe: M1
- Expiration: 3 candles
- Option Types: Call/Put
- Built-in indicators: Volume Delta [hapharmonic]
- Trading instruments: currency pairs , commodities, cryptocurrencies , stocks
- Trading hours: 8:00 - 21:00 Moscow time
- Recommended brokers: Quotex , Pocket Option , Alpari , Binarium
Installing the Indicator for Binary Options Volume Delta
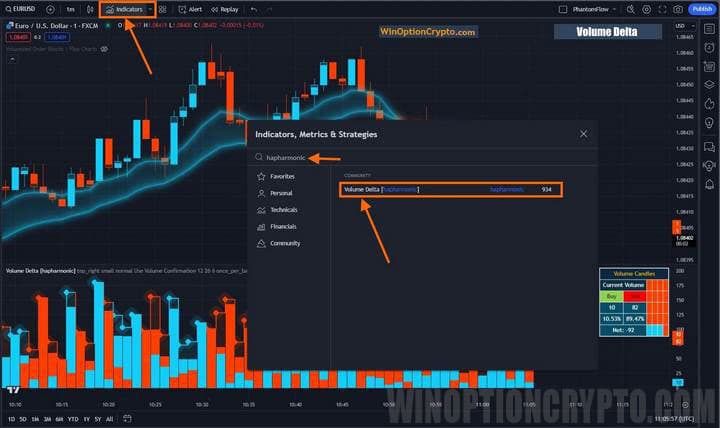
The indicator is installed in the TradingView platform via the menu of the same name at the top of the terminal. Click on the “Indicators” button, the “Indicators, metrics and strategies” panel will open. In its search bar, enter the developer’s name – hapharmonic. Then find it in the list that appears and click on it, having previously checked the indicator’s name – Volume Delta.
Review and Settings of the Indicator for Binary Options Volume Delta
The built-in Volume Delta indicator of the TradingView platform is absolutely free, but much more effective than many expensive commercial developments. Its principle of operation is based on measuring the balance between the pressure of sellers and buyers in one candle. Thanks to this valuable information, traders can assess who is currently dominating the market: buyers or sellers.
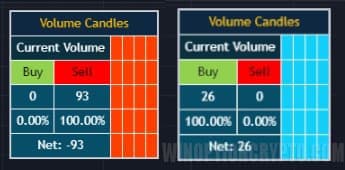
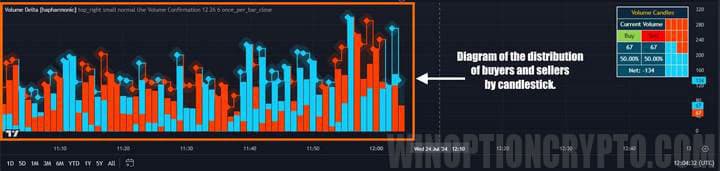
The screenshot above shows the Volume Candles dashboard, which displays real-time information on the number of buy and sell trades, as well as their delta (the difference between buys and sells). This information helps binary options traders identify potentially profitable moments to open trades in the direction of the prevailing delta, following the stronger market force. The dashboard is located at the bottom of the chart, next to the bar chart, which shows how the strength of buyers and sellers is distributed within a single candle.
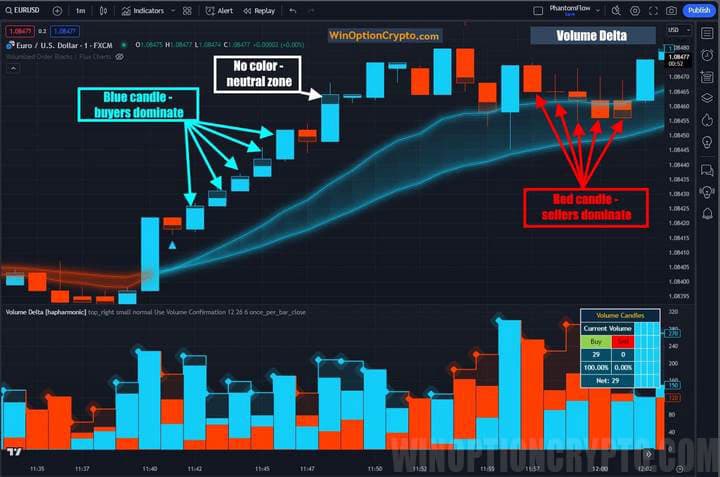
If you look closely at the chart on the left, you will see that the candles where buyers dominated are completely blue, while those where sellers dominated are red. The part of the candles that remained without color indicate a neutral status.
Thus, the Volume Delta binary options indicator provides an idea not only of the total volume traded per candle, which can be estimated by the height of the histogram bar, but also of the percentage of purchases and sales within this candle. Knowing this, a trader will be able to more effectively assess market sentiment and the potential for price movement.
The principle of displaying information is very simple - the body of the candle (the area between the opening and closing prices) is taken as 100% and filled with colors in accordance with the prevailing force (buyers or sellers) in percentage terms. This approach allows you to visualize real market sentiment by calculating the difference between the volumes of completed purchase and sale transactions.
Under the hood, Volume Delta has two exponential moving averages with periods of 12 and 26, the parameters of which can be set in the indicator settings.
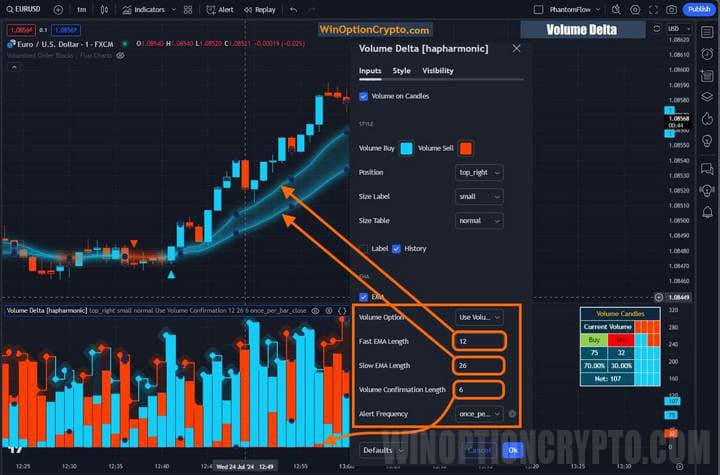
The "confirming volume" is also set there, which influences the appearance of arrows when the moving averages cross, and alerts are configured. The essence of the "confirming volume" is that a signal in the form of an arrow about the crossing of moving averages appears only if the volume in the direction of the crossing exceeds the threshold specified in the settings.
Trading Rules for Binary Options Indicator Volume Delta
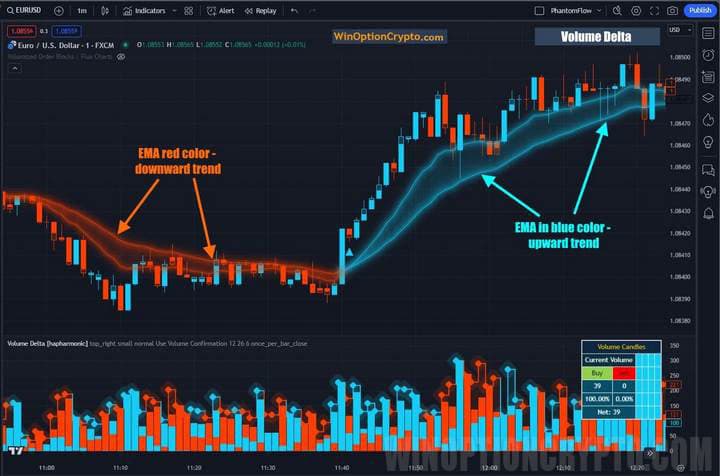
As you might guess, trading on the Volume Delta binary options indicator follows a trend, the direction of which is determined by the intersection and location of the moving averages relative to each other. In the case of a bullish trend, a short EMA with a period of 12 crosses a long moving average with a period of 26 from the bottom up. In this case, the moving averages will be highlighted in blue, and when sellers take the initiative in the market, they will turn red.
Moving averages are technical analysis tools. If you want to learn more about how they work and how they should be used in trading, check out our selection of articles on this topic:
- Technical Analysis of Binary Options
- Technical analysis of cryptocurrencies
- Autochartist: Technical Analysis on Automation
- Book by D. Murphy "Intermarket Technical Analysis"
Opening a Call Option
- We are convinced of the presence of a bullish trend – EMA is blue
- The candle is blue and touches the upper EMA
- The Volume Delta oscillator is completely blue
- At the opening of a new candle we buy Call
Opening a Put Option
- We are convinced of the presence of a bearish trend – EMA is red
- The candle is red and touches the lower EMA
- Volume Delta Oscillator Volume is completely red
- At the opening of a new candle we buy Put
It is recommended to select the expiration time of 3 candles. We advise you to select the holding period of positions based on the results of testing on historical data.
Specifics of Using the Indicator for Binary Options Volume Delta
Please note that the Volume Delta indicator signals in the form of triangular markers are not a call to action. These markers appear at the moment of intersection of the short and long EMA. Moreover, the signals themselves are filtered by the setting of the "Volume Confirmation Length" parameter, which indicates the minimum threshold value for the seller's or buyer's volume, depending on which way the moving averages crossed.
Good results with this strategy can be achieved during the opening of the European and American trading sessions on the Forex market. If you are not yet very familiar with the trading schedule of financial markets, we recommend that you read our article " The Best Time to Trade Binary Options ". In it, you will learn about the main trading sessions and the schedule of the main stock markets.
Pros of the Volume Delta Indicator
A clear advantage of the Volume Delta indicator is the ability to look inside any candle or bar and understand how it was formed: who won in the eternal struggle between supply and demand. If buyers won, the candle will be colored blue; if sellers - red.
In addition, the balance of power in the market can be clearly seen, since the filling of the body of the candles with color occurs depending on the ratio of the proportion of buyers and sellers at the moment of closing the candle. This allows the trader to determine the direction of the market and potential entry points.
The readings of this indicator can be used to confirm signals from other instruments. For example, if the RSI indicator signals a buy, but Delta is negative (red candles), this may be a sign that the signal is false.
Disadvantages of the Volume Delta Indicator
The disadvantages of the Volume Delta indicator include the fact that it does not take into account important factors that influence price movements: the release of key news and the publication of macroeconomic data. Therefore, blindly following the signals of this indicator can lead to losses. Another disadvantage is the complexity of interpreting these signals, which will need to be sorted out.
Conclusion
The Volume Delta binary options indicator allows you to decipher market sentiment and determine the potential of trading opportunities. By calculating the balance between the pressure of sellers and buyers at a certain price level, you can determine the dominant side. With a positive delta, buyers prevail in the market, which means that buying Call options is more likely to bring profit. While a negative delta indicates seller pressure and the need to buy Put options.
Thus, by opening positions in the direction of the prevailing market force, you can significantly increase the percentage of profitable trades and improve the overall efficiency of binary options trading. Before trading on a real account, be sure to practice on a demo account by choosing the best broker from the rating on our website. Open trades, observing the rules of risk and capital management. We wish everyone successful trading!

To leave a comment, you must register or log in to your account.